Key Takeaways
- 🧪 LipoMap by Boston Heart measures 33 lipid markers, including particles, sizes, and apolipoproteins.
- ❤️ Flags hidden cardiovascular risk when LDL-C appears normal but LDL-P or sdLDL-C are high.
- 👤 Best for diabetes, metabolic syndrome, strong family history, or confusing prior lipid results.
- ⏱️ Retest every 3–6 months during changes, then 6–12 months once stable.
- ➡️ Includes LDL-P, apoB, HDL-P, sdLDL-C, VLDL-P, and more (see below).
What is The LipoMap Boston Heart Advanced Cholesterol Test?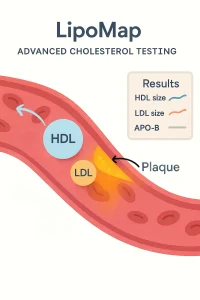
LipoMap by Boston Heart is a blood test that looks deeper at your heart disease risk by looking at markers showing size, density, and APO-B status of your cholesterol.
Think of your blood like traffic on a busy highway. The LipoMap by Boston Heart Lab doesn’t just measure cholesterol, it counts the actual vehicles on the road. ApoB is like the license plate on every risky car, LDL-P tells you how many cars are crowding the lanes, and small particles like LDL-6 act like scooters weaving through gaps, slipping into artery walls even when regular LDL looks fine.
- This advanced lipid testing for heart disease risk breaks your cholesterol into sizes and counts, not just totals like you would get at your yearly physical.
- It covers apolipoproteins (like apoB), which tell how many “bad” particles are actually floating around.
If past cholesterol lab tests showed “normal” but you’re still unsure, this panel can spot hidden risks that a basic lipid panel misses.
Why this advanced lipid testing for heart disease risk matters
Small, simple testing today can prevent big heart problems later.
Some people have low LDL cholesterol but high LDL particle number; that mismatch raises risk. Another quiet clue is small dense LDL-C (sdLDL-C); these tiny “pebbles” hit vessel walls harder than larger LDL. The test also checks HDL-P (good particle count), which can be more telling than HDL-C alone.
With a single draw, you get a full picture: totals, particle counts, sizes, apolipoproteins, and key ratios. Clear results help you and your clinician choose food, movement, or medicine that fits you.
Why consider ordering this detailed cholesterol particle size and number test now — LipoMap by Boston Heart cholesterol test
If heart disease runs in your family, if you have diabetes, or if you want to know what steps to take now to try and prevent heart disease, the LipoMap can help. A less-talked-about marker, the LDL-FC/LDL-C esterification index, can hint at liver or rare enzyme issues when it’s high. Ordering now means you won’t keep guessing; you’ll see the real traffic on your artery highway.
- Great for people with normal LDL-C but strong risk factors, stubborn triglyceride levels, or mixed results from basic cholesterol panels.
- Useful when you want to track true progress from diet, exercise, or meds beyond a basic lipid panel.
Labs Included When Ordering Your LipoMap by Boston Heart Lab
| Test Name | Reference Ranges | What This Biomarker Means | High and Low Levels |
|---|---|---|---|
| Total Cholesterol (TC) | • Optimal: <200 • Borderline: 200–240 • Increased: >240 |
Sum of all cholesterol in the blood. Useful first look at lipid health. Alone, it can miss hidden risk from particle counts. | High: High levels of Total Cholesterol can signal higher cardiovascular risk. However, other markers in this panel show better signals of cardio risk.
Low: Low levels of Total Cholesterol may reflect aggressive treatment or rare conditions; discuss context with your clinician. |
| Direct LDL-cholesterol (LDL-C) | • Optimal (with CVD): <70 • Optimal (without CVD): <100 • Borderline: 70–100; 100–160 • Increased (with CVD): >100 • Increased (without CVD): >160 |
“Bad” cholesterol amount. Helpful, but some people have low LDL-C and still carry many LDL particles, which raises risk. | High: High levels of LDL-C can increase plaque buildup risk.
Low: Low levels of LDL-C generally lower risk; watch for discordance with LDL-P. |
| HDL-cholesterol (HDL-C) | • Optimal (Male): >50; (Female): >60 • Borderline: 40–50; 50–60 • Increased risk: <40; <50 |
“Good” cholesterol amount. Helps carry cholesterol away. HDL particle number (HDL-P) can be more telling than HDL-C. | High: High levels of HDL-C can be protective but context matters.
Low: Low levels of HDL-C may suggest higher risk and less reverse transport. |
| Non-HDL-cholesterol (Non-HDL-C) | • Optimal: <130 • Borderline: 130–190 • Increased: >190 |
All “bad” cholesterol combined (LDL + VLDL remnants). Tracks atherogenic particles better than LDL-C alone when triglycerides are high. | High: High levels of Non-HDL-C signal more atherogenic particles.
Low: Low levels of Non-HDL-C indicate fewer risky particles. |
| Triglycerides (TG) | • Optimal: <150 • Borderline: 150–200 • Increased: >200 |
Fat carried in blood, often from extra calories. Higher TG often means more remnant particles that can harm arteries. | High: High levels of Triglycerides raise CVD and pancreatitis risk at very high levels.
Low: Low levels of Triglycerides generally reduce remnant burden. |
Show more markers
| Test Name | Reference Ranges | What This Biomarker Means | High and Low Levels |
|---|---|---|---|
| Small Dense LDL-cholesterol (sdLDL-C) | • Optimal: <20 • Borderline: 20–40 • Increased: >40 |
Tiny LDL that can slip into artery walls. These particles carry less cholesterol each but do more damage per particle. | High: High levels of sdLDL-C suggest greater atherosclerosis risk.
Low: Low levels of sdLDL-C are favorable. |
| % Small Dense LDL-C (%sdLDL-C) | • Optimal: <20 • Borderline: 20–30 • Increased: >30 |
Percent of LDL that is small and dense. Higher share means more risky particles even if total LDL-C looks fine. | High: High %sdLDL-C indicates more atherogenic particle mix.
Low: Low %sdLDL-C suggests a safer LDL profile. |
| IDL-cholesterol (IDL-C) | • Optimal: <7 • Borderline: 7–12 • Increased: >12 |
Cholesterol in intermediate-density lipoproteins (remnants). High IDL often reflects sluggish clearance of remnant particles. | High: High IDL-C points to remnant atherogenic burden.
Low: Low IDL-C indicates fewer remnants. |
| VLDL-cholesterol (VLDL-C) | • Optimal: <30 • Borderline: 30–40 • Increased: >40 |
Cholesterol inside VLDL particles. Often rises with insulin resistance and high triglycerides. | High: High VLDL-C suggests more remnant risk.
Low: Low VLDL-C is favorable. |
| Apolipoprotein-AI (apoA-I) | • Optimal (Male): >160; (Female): >180 • Borderline: 120–160; 140–180 • Increased risk: <120; <180 |
Main protein of HDL particles. Higher apoA-I often means more functional HDL “helpers.” | High: High apoA-I usually reflects more HDL support.
Low: Low apoA-I may indicate reduced HDL function and higher risk. |
| Apolipoprotein-AII (apoA-II) | • Optimal (Male): >32; (Female): >35 • Borderline: 30–32; 32–35 • Increased risk: <30; <32 |
Another HDL protein. Balances HDL structure; very low levels can point to HDL issues. | High: High apoA-II alone is less concerning; interpret with HDL-P.
Low: Low apoA-II may signal weaker HDL support. |
| Apolipoprotein-B (apoB) | • Optimal: <80 • Borderline: 80–120 • Increased: >120 |
Counts the number of atherogenic particles (one apoB ≈ one particle). Often a clearer risk gauge than LDL-C alone. | High: High apoB means many artery-harming particles.
Low: Low apoB indicates fewer atherogenic particles. |
| TC/HDL-C Ratio | • Optimal (with CVD): <3 • Optimal (without CVD): <4 • Borderline: 3–5; 4–6 • Increased: >5; >6 |
Balance of total cholesterol to protective HDL. Lower ratios are generally better. | High: High ratio suggests higher risk and fewer HDL “helpers.”
Low: Low ratio indicates more favorable balance. |
| ApoB/ApoA-I Ratio | • Optimal (with CVD): <0.5; (without CVD): <0.6 • Borderline: 0.5–0.7; 0.6–0.9 • Increased: >0.7; >0.9 |
Compares “bad” particle count to “good” support. Incorporates both apoB burden and HDL strength. | High: High ratio reflects more atherogenic load versus HDL support.
Low: Low ratio indicates a favorable balance. |
| Total ApoB-carrying Particle Number (Total ApoB-P) | • Optimal: <1400 • Borderline: 1400–2000 • Increased: >2000 |
Total count of all apoB particles (LDL, IDL, VLDL). Direct look at artery-harming traffic volume. | High: High Total ApoB-P signals heavy atherogenic traffic.
Low: Low Total ApoB-P indicates lighter burden. |
| LDL Particle Number (LDL-P) | • Optimal: <1200 • Borderline: 1200–1800 • Increased: >1800 |
Number of LDL particles. When LDL-P is high but LDL-C is low, risk can still be elevated. | High: High LDL-P raises cardiovascular risk even with normal LDL-C.
Low: Low LDL-P suggests lower particle burden. |
| IDL Particle Number (IDL-P) | • Optimal: <70 • Borderline: 70–100 • Increased: >100 |
Count of intermediate remnant particles. Higher counts indicate remnant buildup linked to risk. | High: High IDL-P suggests more remnant atherogenic particles.
Low: Low IDL-P is favorable. |
| VLDL Particle Number (VLDL-P) | • Optimal: <120 • Borderline: 120–180 • Increased: >180 |
Count of very-low-density particles. Often rises with insulin resistance and high triglycerides. | High: High VLDL-P signals more remnant risk and TG load.
Low: Low VLDL-P is favorable. |
| LDL-1 Particle Number (LDL1-P) | • Optimal: <140 • Borderline: 140–190 • Increased: >190 |
Largest LDL subclass. Pattern shifts toward smaller subclasses can increase risk. | High: High LDL1-P alone is less concerning than small subclasses; view with LDL6-P.
Low: Low LDL1-P with higher small LDL may reflect riskier pattern. |
| LDL-2 Particle Number (LDL2-P) | • Optimal: <150 • Borderline: 150–200 • Increased: >200 |
Large-medium LDL subclass. Watch overall pattern, not a single row. | High: High LDL2-P warrants checking small LDL too.
Low: Low LDL2-P is not harmful by itself. |
| LDL-3 Particle Number (LDL3-P) | • Optimal: <190 • Borderline: 190–260 • Increased: >260 |
Mid-small LDL. Rising LDL3-P often precedes growth in very small LDL (LDL5-6). | High: High LDL3-P can mark shift toward riskier LDL profile.
Low: Low LDL3-P is favorable. |
| LDL-4 Particle Number (LDL4-P) | • Optimal: <230 • Borderline: 230–330 • Increased: >330 |
Smaller LDL subclass. More atherogenic than larger LDL types. | High: High LDL4-P adds to atherogenic burden.
Low: Low LDL4-P is favorable. |
| LDL-5 Particle Number (LDL5-P) | • Optimal: <290 • Borderline: 290–400 • Increased: >400 |
Very small, dense LDL. Tends to penetrate vessel walls more easily. | High: High LDL5-P is linked to higher risk.
Low: Low LDL5-P is favorable. |
| LDL-6 Particle Number (LDL6-P) | • Optimal: <300 • Borderline: 300–450 • Increased: >450 |
Smallest LDL subclass measured. High levels mark a highly atherogenic pattern. | High: High LDL6-P indicates very small LDL dominance and higher risk.
Low: Low LDL6-P is favorable. |
| LDL-apoB | • Optimal: <70 • Borderline: 70–100 • Increased: >100 |
Amount of apoB protein within LDL particles. Tracks LDL particle mass. | High: High LDL-apoB suggests many LDL particles or larger load.
Low: Low LDL-apoB indicates lighter LDL burden. |
| IDL-apoB | • Optimal: <4 • Borderline: 4–6 • Increased: >6 |
ApoB within remnant IDL particles. Reflects remnant load that can be atherogenic. | High: High IDL-apoB signals remnant accumulation.
Low: Low IDL-apoB is favorable. |
| VLDL-apoB | • Optimal: <6 • Borderline: 6–10 • Increased: >10 |
ApoB within VLDL particles. High values often track with high TG and insulin resistance. | High: High VLDL-apoB suggests overproduction or slow clearance.
Low: Low VLDL-apoB is favorable. |
| LDL-Triglycerides (LDL-TG) | • Optimal: <24 • Borderline: 24–28 • Increased: >28 |
TG carried inside LDL. Higher LDL-TG often reflects insulin resistance. | High: High LDL-TG points to more TG-rich LDL and risk.
Low: Low LDL-TG is favorable. |
| IDL-Triglycerides (IDL-TG) | • Optimal: <6 • Borderline: 6–10 • Increased: >10 |
TG carried inside IDL remnants. Indicates remnant metabolism status. | High: High IDL-TG suggests elevated remnant TG load.
Low: Low IDL-TG is favorable. |
| VLDL-Triglycerides (VLDL-TG) | • Optimal: <60 • Borderline: 60–90 • Increased: >90 |
TG inside VLDL particles. High values often pair with increased VLDL-P. | High: High VLDL-TG increases remnant atherogenicity.
Low: Low VLDL-TG is favorable. |
| HDL Particle Level (HDL-P) | • Optimal (Male): >38.0; (Female): >42.0 • Borderline: 33.0–38.0; 37.0–42.0 • Increased risk: <33.0; <37.0 |
Count of HDL particles. Often a stronger sign of protection than HDL-C amount. | High: High HDL-P indicates more protective carriers.
Low: Low HDL-P may mean less cholesterol removal capacity. |
| LDL-Free Cholesterol / LDL-C (LDL-FC/LDL-C) | • Optimal: <0.5 • Increased: ≥0.5 |
Ratio showing how well cholesterol is “packaged” in LDL. High ratios can signal reduced esterification (getting cholesterol ready for transport), sometimes seen in liver or LCAT genetic issues. | High: High LDL-FC/LDL-C may indicate metabolic or hepatic concerns.
Low: Low LDL-FC/LDL-C suggests normal esterification. |
| HDL-Free Cholesterol / HDL-C (HDL-FC/HDL-C) | • Optimal: <0.5 • Increased: ≥0.5 |
Ratio within HDL particles. High values may reflect impaired HDL maturation or function. | High: High HDL-FC/HDL-C can point to HDL function issues.
Low: Low HDL-FC/HDL-C suggests normal HDL maturation. |
Ranges may change over time. Check the lab for updated ranges.
According to PubMed (Framingham Offspring Study):
If your LDL-C looks normal but your LDL-P is high (or vice versa), your actual heart risk follows the particle count (LDL-P), not the cholesterol amount (LDL-C).
LipoMap by Boston Heart FAQ
What is this test for?
LipoMap by Boston Heart is a 33-marker lipid analysis that measures cholesterol types, particle number and size, apolipoproteins, and key ratios. It helps find hidden heart risk that basic lipid panels can miss.
What signs and symptoms suggest I might need it?
Family history of early heart disease, high triglycerides, diabetes or insulin resistance, high blood pressure, belly weight gain, or prior “normal” cholesterol with ongoing concern. It’s also helpful if you’ve had mixed or confusing lipid results.
How often should I retest?
Most people retest every 3–6 months when starting lifestyle or medication changes, then every 6–12 months once stable. Your clinician may tailor timing to your risks and treatment plan. We do have a one-on-one results review service to help you better understand your test markers.
How accurate is the test?
The panel uses high-resolution NMR to directly measure lipoprotein particles and related markers. It provides greater detail than a standard lipid panel and is used in clinical practice to refine risk assessment.
Are test results private and confidential?
Receive test results securely on TrueHealthLabs.com under “My Account.” It’s critical that you share them with your physician.
Do I need to fast?
Boston Heart lists no special preparation for LipoMap; many clinicians still prefer an 8–12 hour fast for triglyceride clarity. Follow your provider’s instructions.
Who benefits most?
People with diabetes/metabolic syndrome, strong family history, statin “non-responders,” high triglycerides, or prior heart events who need deeper insight.
Will this change my treatment?
Results can guide personalized steps: food pattern changes, activity, weight goals, and medications like statins, ezetimibe, or PCSK9s when appropriate.
Medical Review Board
Reviewed by Jeff Donohue M.D. from Body Logic and Brady Hurst DC, CCCN. Written by True Health Lab’s team of editorial health contributors.
Disclaimer: This information is for educational purposes only and not intended as medical advice. Consult your healthcare provider for personalized guidance.
Why Customers Trust True Health Labs – What People are saying
Also rated 4.6 out of 5 based on 3452 ShopperApproved reviews- See all TrueHealthLabs.com reviews.